December 19, 2014

by Benjamin Recchie, AB’03
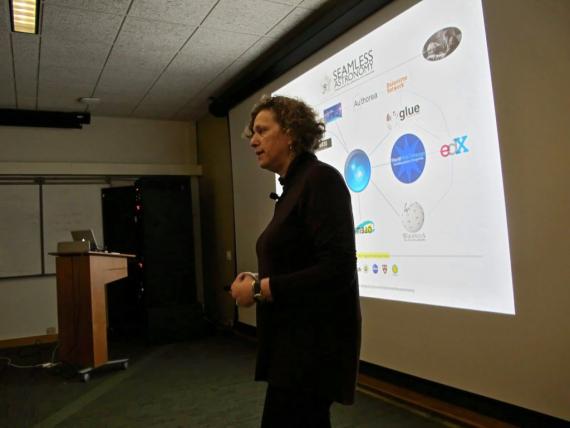
“There are two kinds of people who know that humans are better than computers,” says Alyssa Goodman, professor of astronomy at Harvard University, research associate of the Smithsonian Institution, and the founding director of the Harvard Initiative in Innovative Computing: “small children” (who know that humans are best at everything) “and visualization researchers” (who know that the best algorithms can’t match even a child’s ability to recognize patterns). Goodman was in town for the .astronomy conference, but stopped by the University of Chicago as part of the Research Computing Center’s Visualization Speaker Series to give a talk titled “Visualization of High-Dimensional Data and the Paper of the Future.” Her point about children and computers indicated the need for scientists to maximize understanding of their results by presenting their increasingly complex data in increasingly sophisticated ways.
Goodman decried the barriers she sees being put up between “visual analytic science,” “information visualization,” and “scientific visualization.” The distinctions were unnecessary, she argued, and could actually hamper research. To prove her point, she showed an example from an astronomical research paper in which an infographic (usually considered the domain of information visualization) was embedded inside of a scientific image (considered to be scientific visualization). The combined image was more effective than either approach alone.
Another way that complex data could be better visualized was by presenting it in multiple dimensions. In the past, Goodman explained, 3D visualization was typically used only to show off data to a wider audience—but she argued that in the future researchers will want to use it to interrogate data instead. To demonstrate, she gave the example of the Perseus shell, a cloud of gas in deep space. By carefully analyzing the motion of the gas, astronomers were able to tease out its three-dimensional structure. Goodman first showed a two-dimensional graphic of the shell, then showed a 3D version of the cloud and rotated it. In three dimensions, the audience could easily make out a spherical void that was almost impossible to see in the 2D image.
It’s all in service of Goodman’s idea of the scientific paper of the future—which wouldn’t be “paper” at all, given the growing trend for research to be accessed electronically. In fact, she predicted the ideal medium would be a kind of e-ink that could be used to form a “programmable paper,” including updates and an interactive combination of language, data, and pictures. One step in that direction is Glue, a Python code library that enables linked views of high-dimensional data. Highlighting one cluster of points on a scatter plot highlights those same points on other, linked plots, allowing the reader to understand the correlation between graphs. Another step is using Authorea, a program that allows authors to collaborate on writing a journal article online; Goodman and others (including UChicago researcher Jeff Montgomery, AB’13) are working to modify Authorea to include Glue-like functionality.
Despite these glimpses of an all-digital future, Goodman said that she herself wasn’t ready to charge head-first into a completely paperless world. She doesn’t keep hard copies of her work, but still prints out her family pictures to place into albums. “I’m willing to risk my research,” she noted wryly, “but not my family.”