September 11, 2019
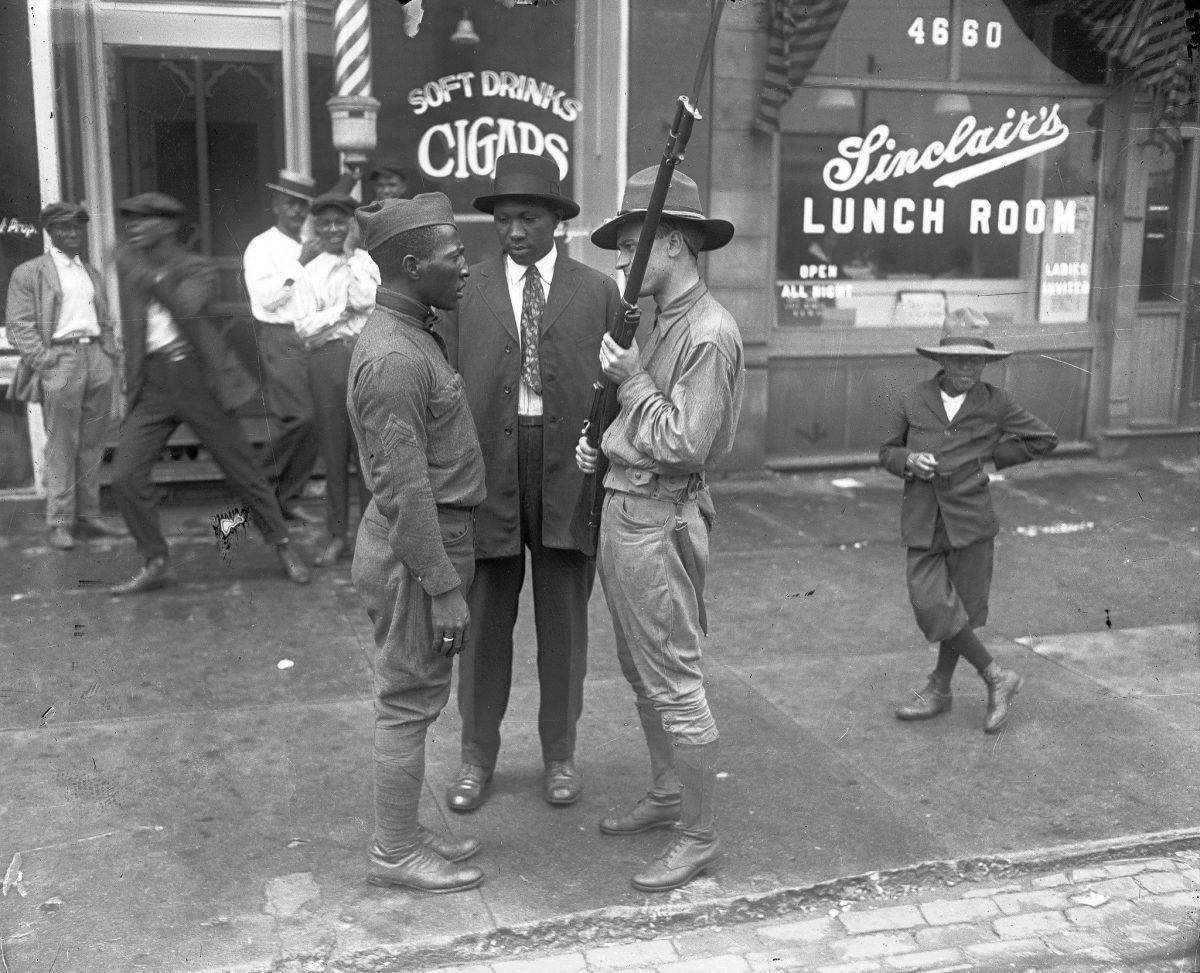
State militia faces off with an African-American veteran during the 1919 Chicago race riots. - Chicago Tribune historical photo
By Jack Wang
Interactive map built by UChicago scholar and students sheds new light on riots
On the afternoon of July 27, 1919, Eugene Williams drifted across an imaginary color line in the water at 29th Street Beach. Soon, white residents began throwing stones, preventing the black teenager from coming ashore. His drowning sparked the largest race riots Chicago has ever seen—a week that saw 38 deaths and hundreds of injuries.
A century later, a University of Chicago scholar and a team of students have helped shed light on that painful but oft-overlooked part of history—one that continues to resonate through the city and its enduring patterns of segregation. Earlier this year, the researchers built an interactive map that allows users to see where deaths and injuries occurred—marked by red and blue dots and Xs—and view original newspaper articles and photos from the riots.
“If you can see the riots on a map and visualize them, you’re put into that time and place,” said Maggie Lu, a rising second-year student who worked as one of the project’s research assistants.
Navigating the map gives users a glimpse of the lives lost. Click the red dot on the shore of Lake Michigan, and details about Williams pop up: a grocery porter, born in Georgia, living at 3921 Prairie Ave. A white man named George Stauber was eventually charged with manslaughter after an officer declined to arrest him at the scene. He was not convicted.
Williams’ death set off a wave of violence—much of which erupted along Wentworth Avenue, the western boundary of Chicago’s “Black Belt.” Although scholars attribute segregation in the city to a variety of political and social factors, the 1919 riots could help explain why those boundaries have remained intransigent for decades.
“Looking at segregation in Chicago, you see particular streets that have become persistent color lines,” said John Clegg, a UChicago historical sociologist who oversaw the mapping project. “When we ask why—well, one reason may be that there was a moment of violence at its origin.”
Led by Clegg, Lu and fellow undergraduates Bokyoung Kim and Kian Yoo-Sharifi spent months combing through archival records, finding data points that place the injuries, deaths and arsons from the riots onto a modern-day map of Chicago.
Roughly a mile west of where Williams drowned, a red dot marks the death of Samuel Banks, a black teenager who was shot in the abdomen. A couple of blocks south, a dot for black police officer John Simpson, also shot and killed. Three miles north, another fatal shooting: Paul Hardwick, a black, 51-year-old waiter who had been attacked while eating breakfast. Of the 38 people who died, 23 were black.
Clegg and the students had originally hoped to rely on coroner’s reports, but the Cook County Medical Examiner’s Office lacked a comprehensive list of those killed during the riots.
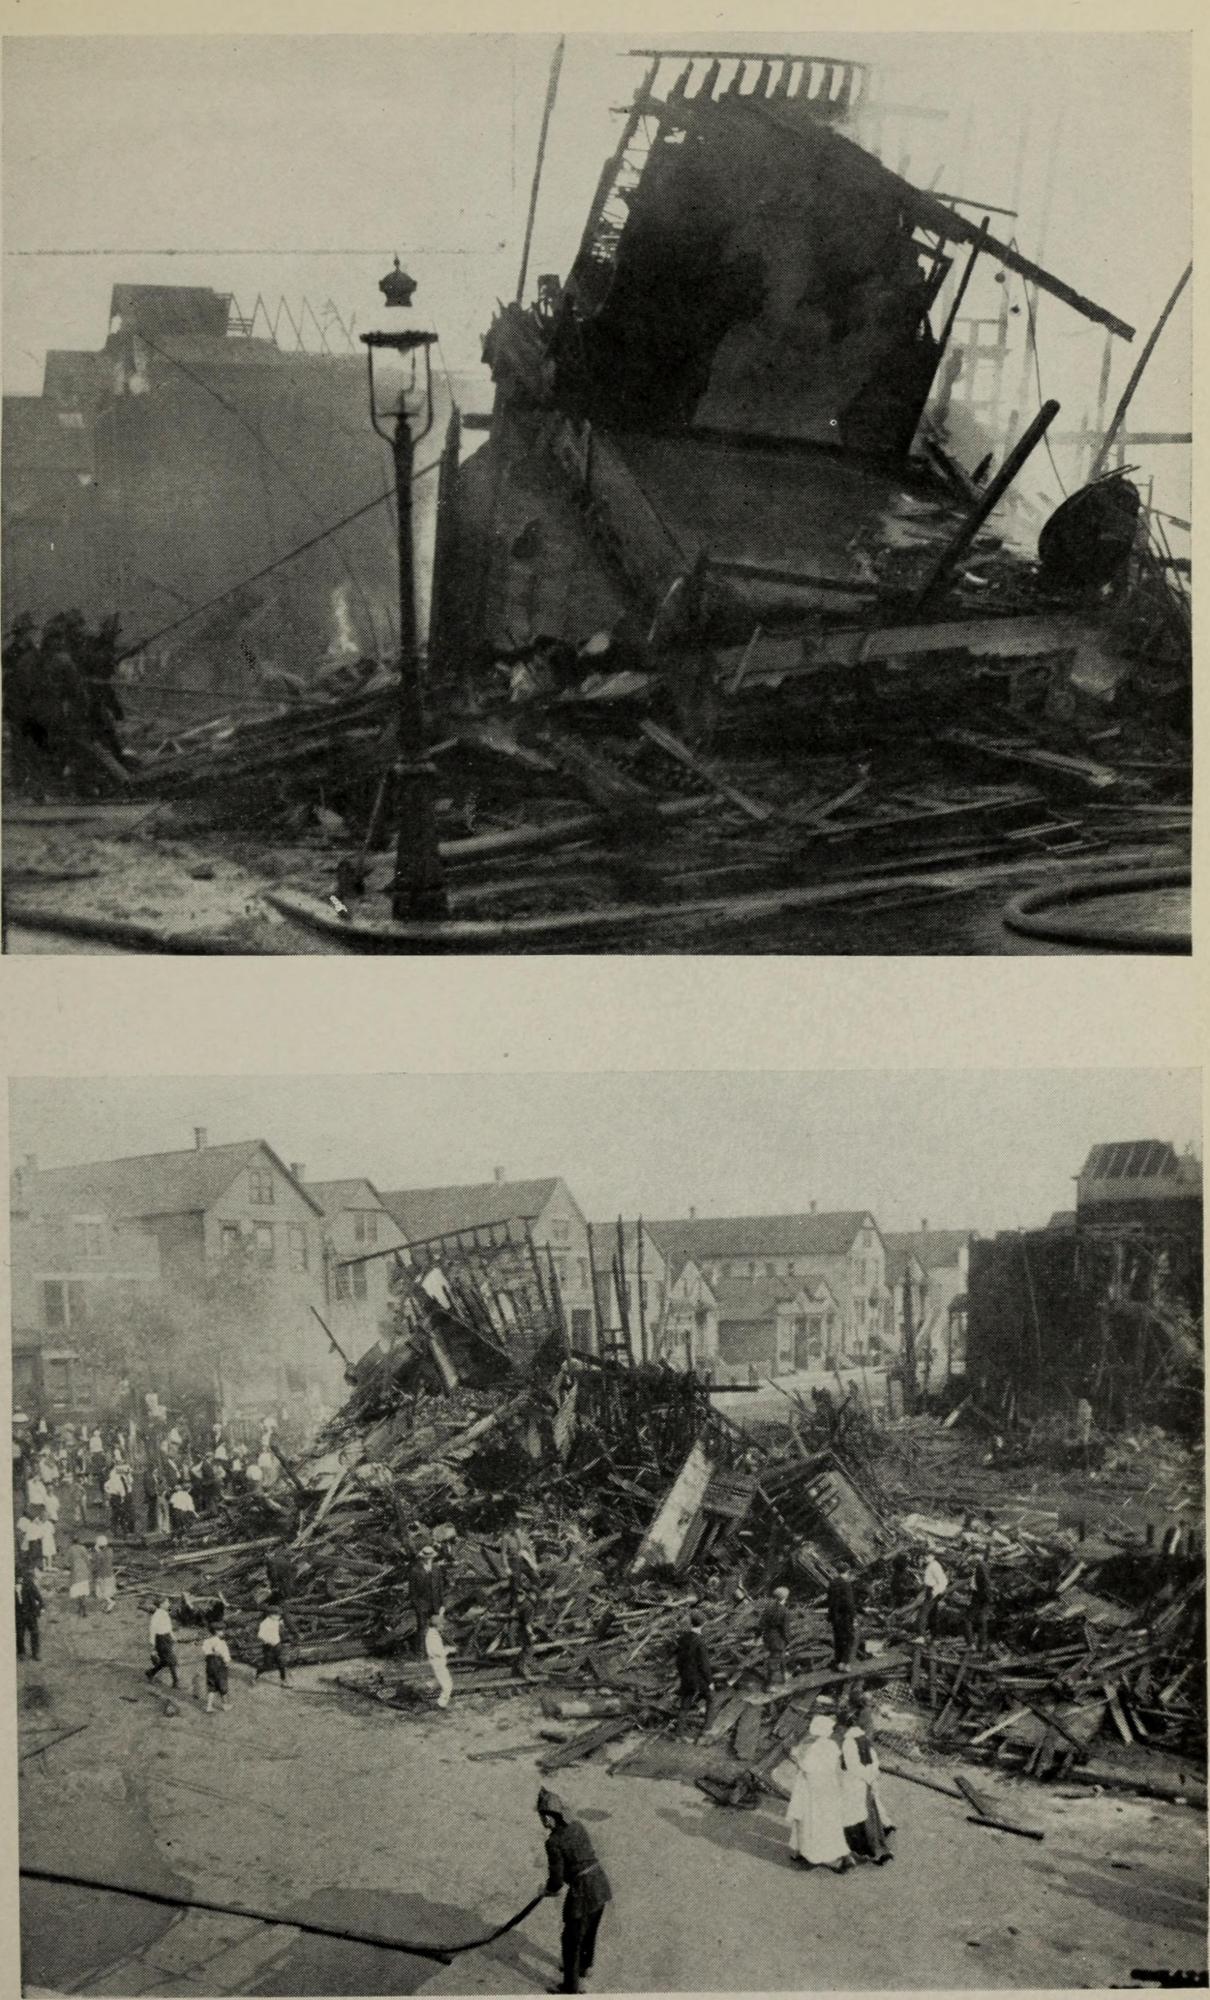
Aftermath of a fire in the Back of the Yards neighborhood - Photo from Chicago Commission on Race Relations
“The idea that there’s almost no history of these people having existed—that was devastating to think about,” said Kim, a rising second-year student.
So, they paired what they found in coroner’s reports with information from newspaper archives, much of which they discovered in UChicago Library’s Special Collections Research Center.
Also key to the researchers’ efforts was The Negro in Chicago, a 1922 study produced by the Chicago Commission on Race Relations that reinvestigated many of the deaths and injuries. Illinois Gov. Frank Lowden, who appointed the committee, wrote in a foreword that the “report does not pretend to have discovered any new formula by which all race trouble will disappear. The subject is too complex for any such simple solution.”
Clegg and his team included a disclaimer on their project, noting that the accuracy of their sources could vary due to biases or omissions. Newspapers, for example, showed fewer black injuries than the report produced by Lowden’s multiracial committee—a difference illustrated by the map’s separate layers.
A collegiate assistant professor at UChicago, Clegg specializes in slavery and the roots of mass incarceration, although he does not claim to be an expert on the 1919 riots. A relative newcomer to the city, he was inspired to delve deeper into its history when he read Race Riot, a 1996 book by University of Kansas scholar William M. Tuttle.
The new map, Clegg said, highlights how Chicago’s black residents were at risk of being victimized across much wider swaths of the city, which could indicate that black workers were attacked for venturing outside of their own neighborhoods. White deaths and injuries, on the other hand, were more spatially concentrated.
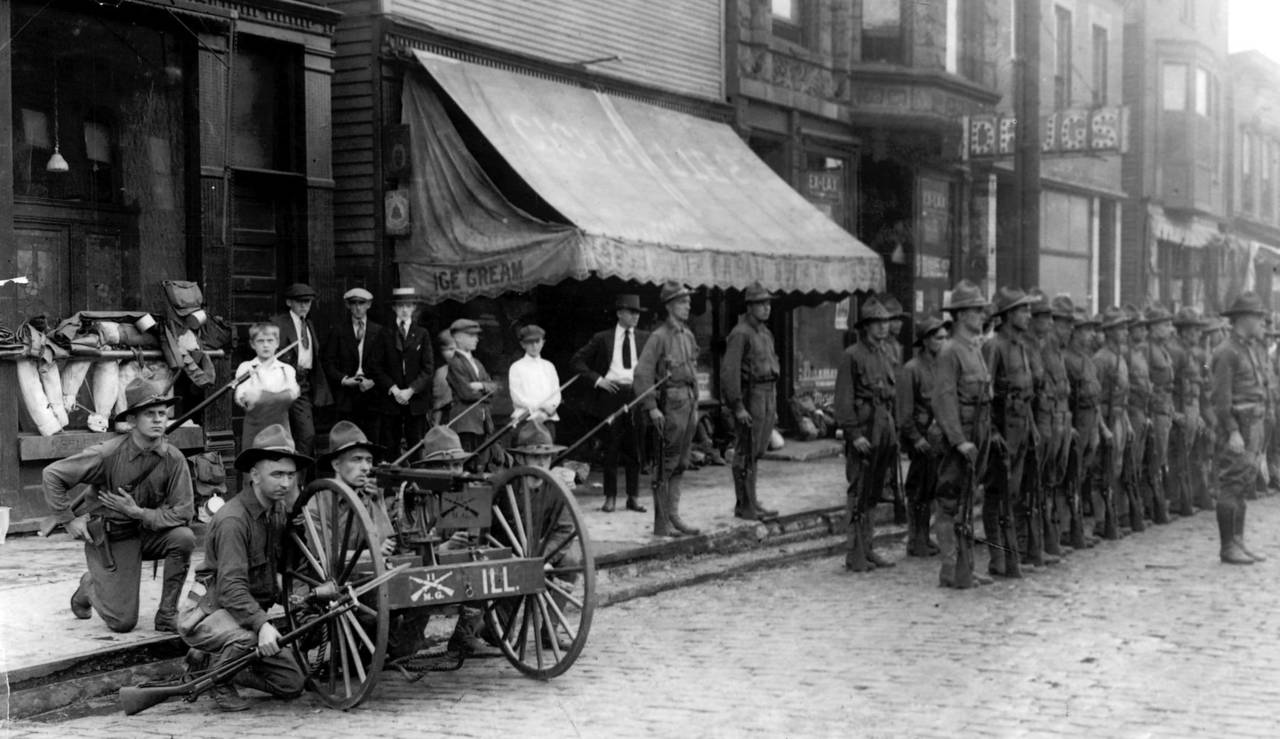
State militia troops gather at 47th Street and Wentworth Avenue during the riots - Chicago Tribune historical photo
Having a visual representation of the riots, he said, could help scholars research the history of segregation and how it was enforced through violence—or the mere threat of it.
“It’s quite possible that the 1919 race riot actually formed Chicago’s neighborhoods,” Clegg added. “It’s a possibility that we want to investigate: Why do certain streets, certain blocks remain these ultra-segregated places across generations? They have almost a physical memory of this long history of racial violence.”
Clegg and his team mapped the riots with help from the Visualization for Understanding and Exploration (VUE) research project, a data visualization project supported by the Neubauer Collegium and hosted at UChicago’s Research Computing Center. The map was created by the RCC’s Milson Munakami (a member of the application development team) and Parmanand Sinha (a computational scientist), and was partly developed at the RCC’s VUE Hackathon, run by Kazutaka Takahashi.
The map has been featured by the Newberry Library, which has organized a yearlong event series that reflects on the riots and how they continue to inform the lived experiences of Chicago residents. It also provided information for the installation of artistic markers at the spots of the riot deaths, a project spearheaded by historians Peter Cole of Western Illinois University and Elizabeth Todd-Breland, PhD’10, of the University of Illinois at Chicago.
“It’s quite possible that the 1919 race riot actually formed Chicago’s neighborhoods.
Clegg hopes the map can continue to serve as a resource—both to help scholars and for the public to see how the past still affects the present.
“I don’t exactly know the answers,” he said, “but I know the questions.”
This article was originally published on the UChicago News website.