
Since 2012, the RCC’s Data Visualization Lab has served as the hub of data analysis, visualization, and technology-enabled pedagogy at the University of Chicago. Located in the Kathleen A. Zar room of the Crerar Science Library, the lab is home to a suite of visualization resources. These include high-end 3D graphics processing and display hardware, virtual reality and haptic display systems, support for interactive supercomputing, and custom remote visualization tools for in-situ visualization of data stored on the RCC’s compute cluster.
Access to these resources is provided to all University of Chicago faculty, researchers, and students. The lab provides introductions and hands-on training for the RCC visualization resources. In addition, the lab hosts hackathons, symposia, and other outreach events designed to support faculty research and share their findings with future students, faculty, alumni, and visitors from granting agencies.

Hardware Resources in Data Visualization Laboratory
Data Visualization Tiled Wall Display System


We have an interactive visualization environment that provides a dynamic, desktop-like windowing system with built-in media viewing capability that supports ultra high-resolution imagery. The Tiled Wall Display System includes the following key features:
-
A 6 x 3-tile display wall system with a 55-inch touch-screen per tile
-
Each display has Hight Definition resolution (1920 x 1080)
-
An ultra-narrow bezel width of 3.5 mm.
-
The total wall dimensions: 23.9′ x 6.7′
-
A total resolution of 11520 x 3240 pixels, or 37.3 Megapixels
-
Connected to a dual-boot workstation (Microsoft Windows 10 and Ubuntu Linux) with 3 NVIDIA Quadro P6000 GPUs.
-
It has additional connections to enable projection from a laptop or other portable device.
-
Touch Screen Overlay of 12 simultaneous touch points.
-
Connection to a 5.1 Audio System
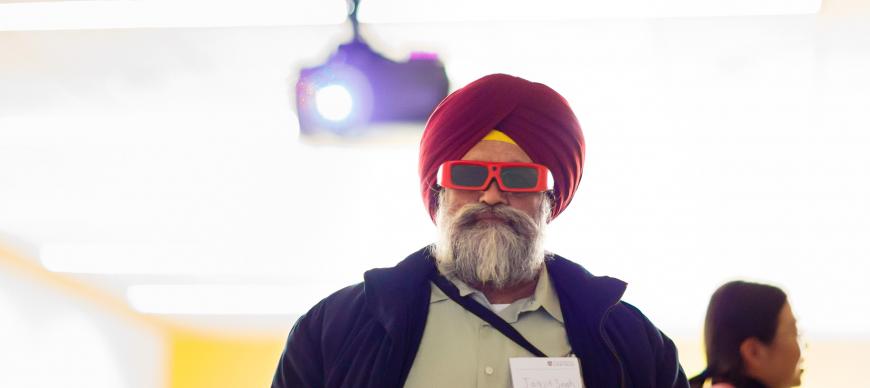
High-Performance Visualization Workstation Coupled with an Active Stereoscopic Projector
It is a 3D Visualization system that is connected to a high-performance visualization workstation.

-
The high-performance visualization workstation is equipped with a NVidia Quadro 5000 GPU and a high-performance 6 TB locally attached disk array
-
3D active stereoscopic projector which provides a 2.3 MPixel active-3D display
-
The workstation is connected to the RCC HPC compute cluster (Midway) and storage system to provide interactive supercomputing
-
30 pairs of 3D glasses are provided for any kind of presentation
Virtual Reality System: HTC Vive
A virtual reality system, true-to-life interactions, HD haptic feedback, and 360 degrees motion tracking.

-
1 Headset with a dual AMOLED 3.6’’ diagonal screen and integrated microphone
-
Headset resolution: 1080 x 1200 pixels per eye (2160 x 1200 pixels combined)
-
Provides true-to-life interactions, HD haptic feedback, and 360 degrees motion tracking
Sensable Phantom Omni Haptic Device
A device that applies force feedback on the user’s hand, allowing a realistic feel of the virtual objects and producing touch sensations as the user is exploring the 3D model.

-
Workspace: 6.4″ W x 4.8″ H x 2.8″ D
-
Range of motion: Hand movement pivoting at wrist
-
Nominal position resolution: > 450 dpi
-
Backdrive friction: < 1 oz
-
Force feedback: x, y, z
-
Position sensing: x, y, z (digital encoders)
Kinect for Windows
A system that provides full-body 3D motion capture, facial and voice recognition. Kinect is tracking as many as six people and 25 skeletal joints per person.

-
Motion sensor providing full-body 3D motion capture, alongside facial and voice recognition.
Immersive Multi-Touch Virtual Reality Workbench
A visualization system that combines touch screen technology with 3D stereo projection and motion tracking.

-
A 4’x’3’ multi-touch table with a 9’x5’ vertical screen that provides an immersive view of the environment.
-
Offers a stereoscopic head-tracked view
Mobile Virtual Reality Systems
Google cardboards and Google Daydream virtual reality systems that allow 3 degrees of freedom movement interaction.

-
20 Google cardboard headsets with biconvex lenses
-
20 Google cardboard magnetic controllers
-
2 Google Daydream headsets
-
2 Google Daydream wireless controllers
Software Resources in Data Visualization Laboratory
RCC provide access to the following visualization tools. Data visualization specialists offer training and support to the users that are planning to use any of the data state-of-the-art visualization tools.
OpenSpace Project

OpenSpace is open source, interactive data visualization software designed to visualize the entire known universe and to portray our ongoing efforts to investigate the cosmos. Funded in part by NASA, OpenSpace brings the latest techniques from data visualization research to the general public. OpenSpace supports interactive presentation of dynamic data from observations, simulations, and space mission planning and operations. OpenSpace works on multiple operating systems, with an extensible architecture powering high resolution tiled displays and planetarium domes, and makes use of the latest graphic card technologies for rapid data throughput. In addition, OpenSpace enables simultaneous connections across the globe, creating opportunity for shared experiences among audiences worldwide.
Current areas of focus within OpenSpace include: Visualization of dynamic simulations via interactive volumetric rendering, as a priority for communicating research in astrophysics; Utilization of NASA’s SPICE observational geometry system with its Planetary Data Service (PDS) to enable space mission visualization that reveal how missions are designed to gather science; and, Globe browsing techniques across spatial and temporal scales to examine scientific campaigns on multiple planets, including close up surface exploration.
SAGE2

Current web-based collaboration systems, such as Google Hangouts, WebEx, and Skype, primarily enable single users to work with remote collaborators through video conferencing and desktop mirroring. The original SAGE software, developed in 2004 and adopted at over one hundred international sites, was designed to enable groups to work in front of large shared displays in order to solve problems that required juxtaposing large volumes of information in ultra high-resolution. SAGE2, a complete redesign and implementation of SAGE, uses advances in cloud-based and web-browser technologies in order to enhance data intensive co-located and remote collaboration.
SciViz
Developed by the Research Computing Center SciViz is a remote visualization tool that allows users to run graphics-intensive applications remotely. Visualization software can be run on the Midway compute cluster with all graphical output sent to a the user’s local machine. Through SciViz, a user can directly visualize data stored on Midway without having to transfer the data to a local visualization workstation. The SCiViz server runs on Midway’s high-performance GPU-equipped compute nodes, making it possible to run high-end visualization software regardless of local hardware capabilities.

Amira

Thermo Scientific Amira Software is a powerful, multifaceted 2D-5D platform for visualizing, manipulating, and understanding life science research data from many image modalities, including CT, MRI, 3D Microscopy, and other techniques.
3D Slicer

ParaView

Others: Nvidia Mosaic, Worldwide Telescope, etc.
Projects
The RCC’s Data Visualization Lab supports faculty research in wide-ranging fields across the university. Projects that we have collaborated on include:

Reconstructing neuronal lineages using whole-brain cell tracking
This project examined a class of migratory motor neurons called the facial branchiomotor neurons (FBMNs), which control facial expression and jaw movement in mammals and are conserved across vertebrates. Where all neurons migrate from their birthplaces to a set of final locations where they integrate into the surrounding neural circuitry, FBMNs specifically migrate from their birthplace in the fourth rhombomere (segment) of the hindbrain to the sixth and seventh rhombomeres, where they coalesce into distinct bilateral nuclei. Using By examining this process in Zebrafish, the project identified a new mechanism contributing to the specific migration pattern of FBMNs.

Bento Box
Bento Box is a virtual reality visualization environment that simulates the blood flow around a cardiac lead in the right atrium of the heart. Designed to support cardiologists as they train medical students and prepare for heart replacement valve surgery, it allows for the generation and sub-volume selection of multiple time-varying data instances. Bento Box is a collaborative tool between Dr. H. Birali Runesha, Assistant Vice President for Research Computing and Director of the Research Computing Center, and the University of Minnesota.
Brain Atlas

Brain Atlas is an interactive digital tool that allows users to explore the major neuroanatomical structures of the brain. Through its online interface and its database of MRI scans, this project supports neurobiological teaching and learning, as well as testing and correlating lesions found on patients' scans. The development of Brain Atlas was headed by Professor Hekmat-Panah MD, a neurosurgeon and neurologist with 35 years of experience.

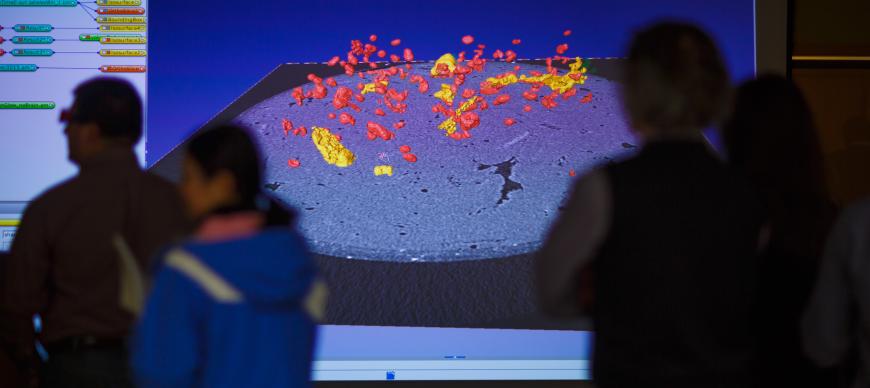
Characterizing the Reflectivity in Cephalopod Skin
This project used Serial Block Face (SEM) imaging to examine the three-dimensional ultrastructure of the fin spot of a European cuttlefish (Sepia officinalis). A member of the cephalopod class of marine animals, these fish have sophisticated camouflage capabilities which are made possible by the optical properties of their skin. This is due to the fact two classes of cells that are embedded in their skin contain biological nanoparticles whose material properties and shapes enable them to diffuse and reflect light in unusual ways. These cell types — leucocytes and iridocytes — jointly produce one of the most extreme white reflectivities known in the animal world. Where earlier work [Mäthger et al., 2013] focused on the optical properties of the leucocytes, this project explores the relative roles of each optical component in producing the bright white reflectance observed at the macroscopic level.

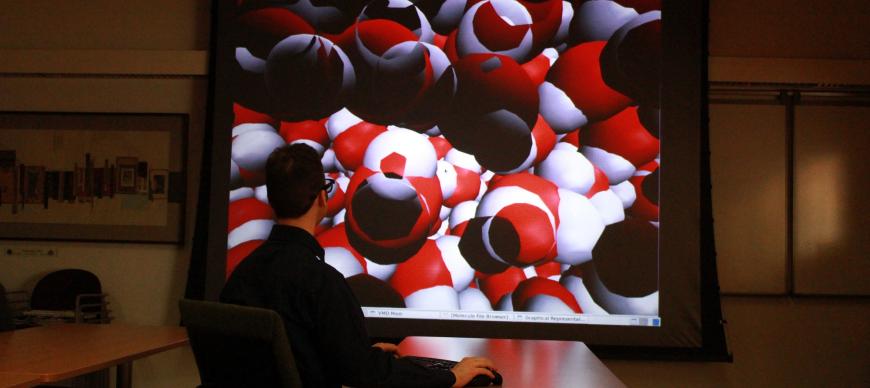
Chemistry Lab - VMD
Once a year, at the culmination of the class [], Professor Esmael Jafari Haddadian invites his students to visualize the protein simulations that they developed over the course of the term. Their visualizations use a combination of VMD, the 3D stereoprojector, and the RCC compute cluster.

OpenSpace: Mars
In collaboration with the Adler Planetarium, the RCC’s Data Visualization Lab is working to produce high-resolution images of Mars. This collaboration makes use of OpenSpace, an open source, interactive data visualization tool that was designed to visualize the entire known universe and to portray our ongoing efforts to investigate the cosmos. OpenSpace was developed by NASA, LIU, and the AMNH.

Visualization for Understanding and Exploration (VUE)
Visualization for Understanding and Exploration (VUE) is a research project that explores how data visualization may be leveraged to conduct and convey research in the humanities and the humanistic social sciences. In addition to a speaker series that foregrounds innovative research in humanistic data visualization, VUE offers a suite of visualization workshops designed for humanists. It also provides ongoing technical support to humanist researchers with projects that seek to visualize research that engages with text analysis and geographical mapping. VUE is supported by the Neubauer Collegium for Culture and Society.
Visualization of Villi Cells

Villi are finger-like projections that line the interior of the intestines; they grow out of an underlying substrate consisting of "crypt" cells. Their simulations grow the villi on a planar surface -- picture a forest of cylinders growing upwards from a ground plane made of crypt cells. Simulations include at least 3 different species/types of cell and each villus is comprised of several hundred cells. The goal of the project is to develop a rendering method to visualize the villi cells simulation output. This project was done in collaboration with Prof. Gary An, MD (Department of Surgery).

Education and Teaching Support
The Research Computing Center is committed to supporting technology-enabled pedagogy across the university. In addition to the 50 workshops that it offers annually, the RCC is presently in the final planning stages to offer discipline-specific non-credit courses in partnership with a faculty advisory committee and the divisional Deans. These courses will make use of an active learning classroom set up in the Data Visualization Lab’s Zar room.