 by Benjamin Recchie
The traditional social science approach to describe a neighborhood quantitatively resembled the Census: using information like number of people in a household, income, and age, sociologists tried to find ways in which one neighborhood resembled another, enough to draw general conclusions. But this older framework had its limitations. For one thing, it was heavily weighted toward life in American cities, which limited its usefulness in describing cities abroad. For another, two people with otherwise identical backgrounds and incomes might behave differently and prefer very different lifestyles.
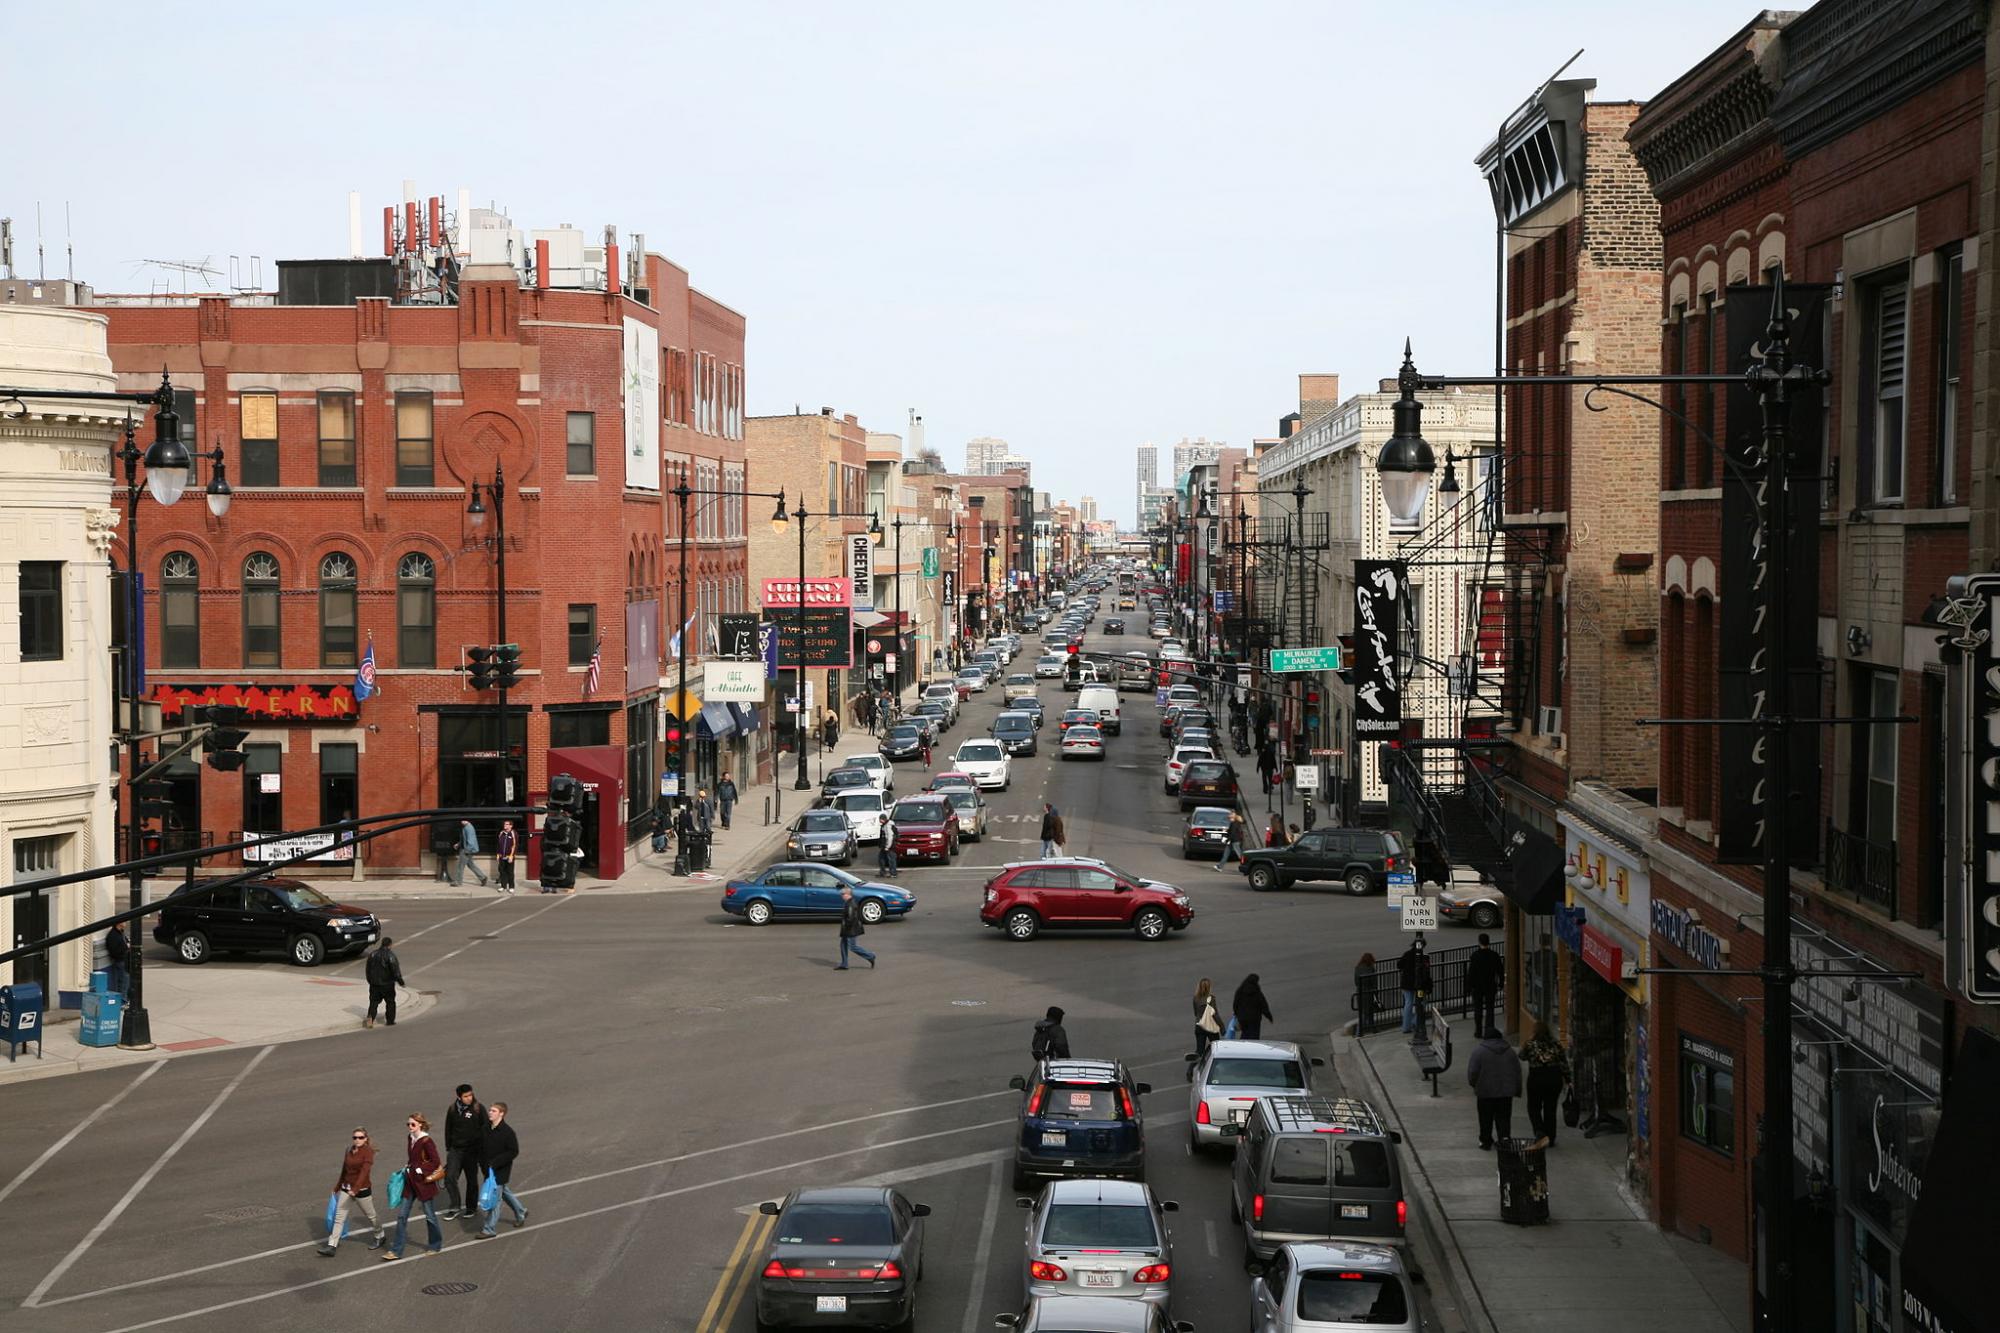
Terry Nichols Clark, professor of sociology, has been working on understanding the social and political organization of cities for decades. But over the last few years, he's been working on methods to address the shortcomings of these existing models. "People are less narrowly determined by their primordial attachments--race, class, gender," he says. "They're still there, but people are more free to choose." Clark and his colleagues instead have developed a concept he calls “scenes.” A scene is a description of a neighborhood based on standard data plus lifestyles captured by new activities and the amenities nearby--a superior way, they think, to describe the way people live, work, and consume in today’s post-industrial, knowledge-driven society. He and his collaborators have identified 15 different aspects that can be used to describe a scene, such as egalitarianism and glamour. In turn, these are measured using a list of over 700 indicators, such as the proximity of Starbucks, public schools or concert venues, and 150 lifestyle survey questions.
Needless to say, trying to compile data for 700 indicators for every ZIP code in the United States presented a considerable challenge. (And the Scenes Project collaborators are not limited to the US—they’re working in multiple foreign countries, from Poland to Korea.) Whereas demographic and income information is easily gleaned from public sources and surveys, the information for the scenes project had to be aggregated from multiple sources. Clark gives the example of musical acts: “We got data on musical bands that performed all over the world, but focused on the city where they originated. This permitted us to characterize cities in terms of musical style and interrelated types of bands and themes by cross-classifying cities with about 120 band types.” They came up with types like Rave (“acousmatic, electronica, hard house, techno, industrial, progressive house, tape music, and trance”) and Exotic (“Hawaiian, tropical, turntablism, visual, western swing”).
Some of this public information was gathered manually, but other data was scraped from the World Wide Web—an uncommon tactic in sociology. The Research Computing Center helped Clark to deal with the large amount of data the project acquired, as well as manipulating and merging it. His students consulted with RCC experts about technical questions as well. (They contributed a poster on their work for the Mind Bytes 2015 research computing symposium; you can see it here.)
Even after more than a decade of work, Clark and his scenes collaborators are still improving their models. Next up is adding a more systematic analysis of social media and text messages exchanges; they intend to link them to geographic areas to create richer indicators of scenes. The collaborators are also adding data from more countries and new themes, such as bicycling and arts activities.
"Societies are changing," Clark says, referring to the self-reordering of postindustrial America. But just as societies change, so too will our ways of thinking about societies--and computation will have pointed the way.